ProveyourImpact.
CommunitybyCommunity.
Most impact reports are educated guesses in a slide deck. We help you collect the real thing: photos, video, audio, and surveys from the communities you work in. Then we turn it into proof you can put in front of a board, one ZIP code at a time.
- Measured by ZIP code
- Four ways to see impact
- AI you control
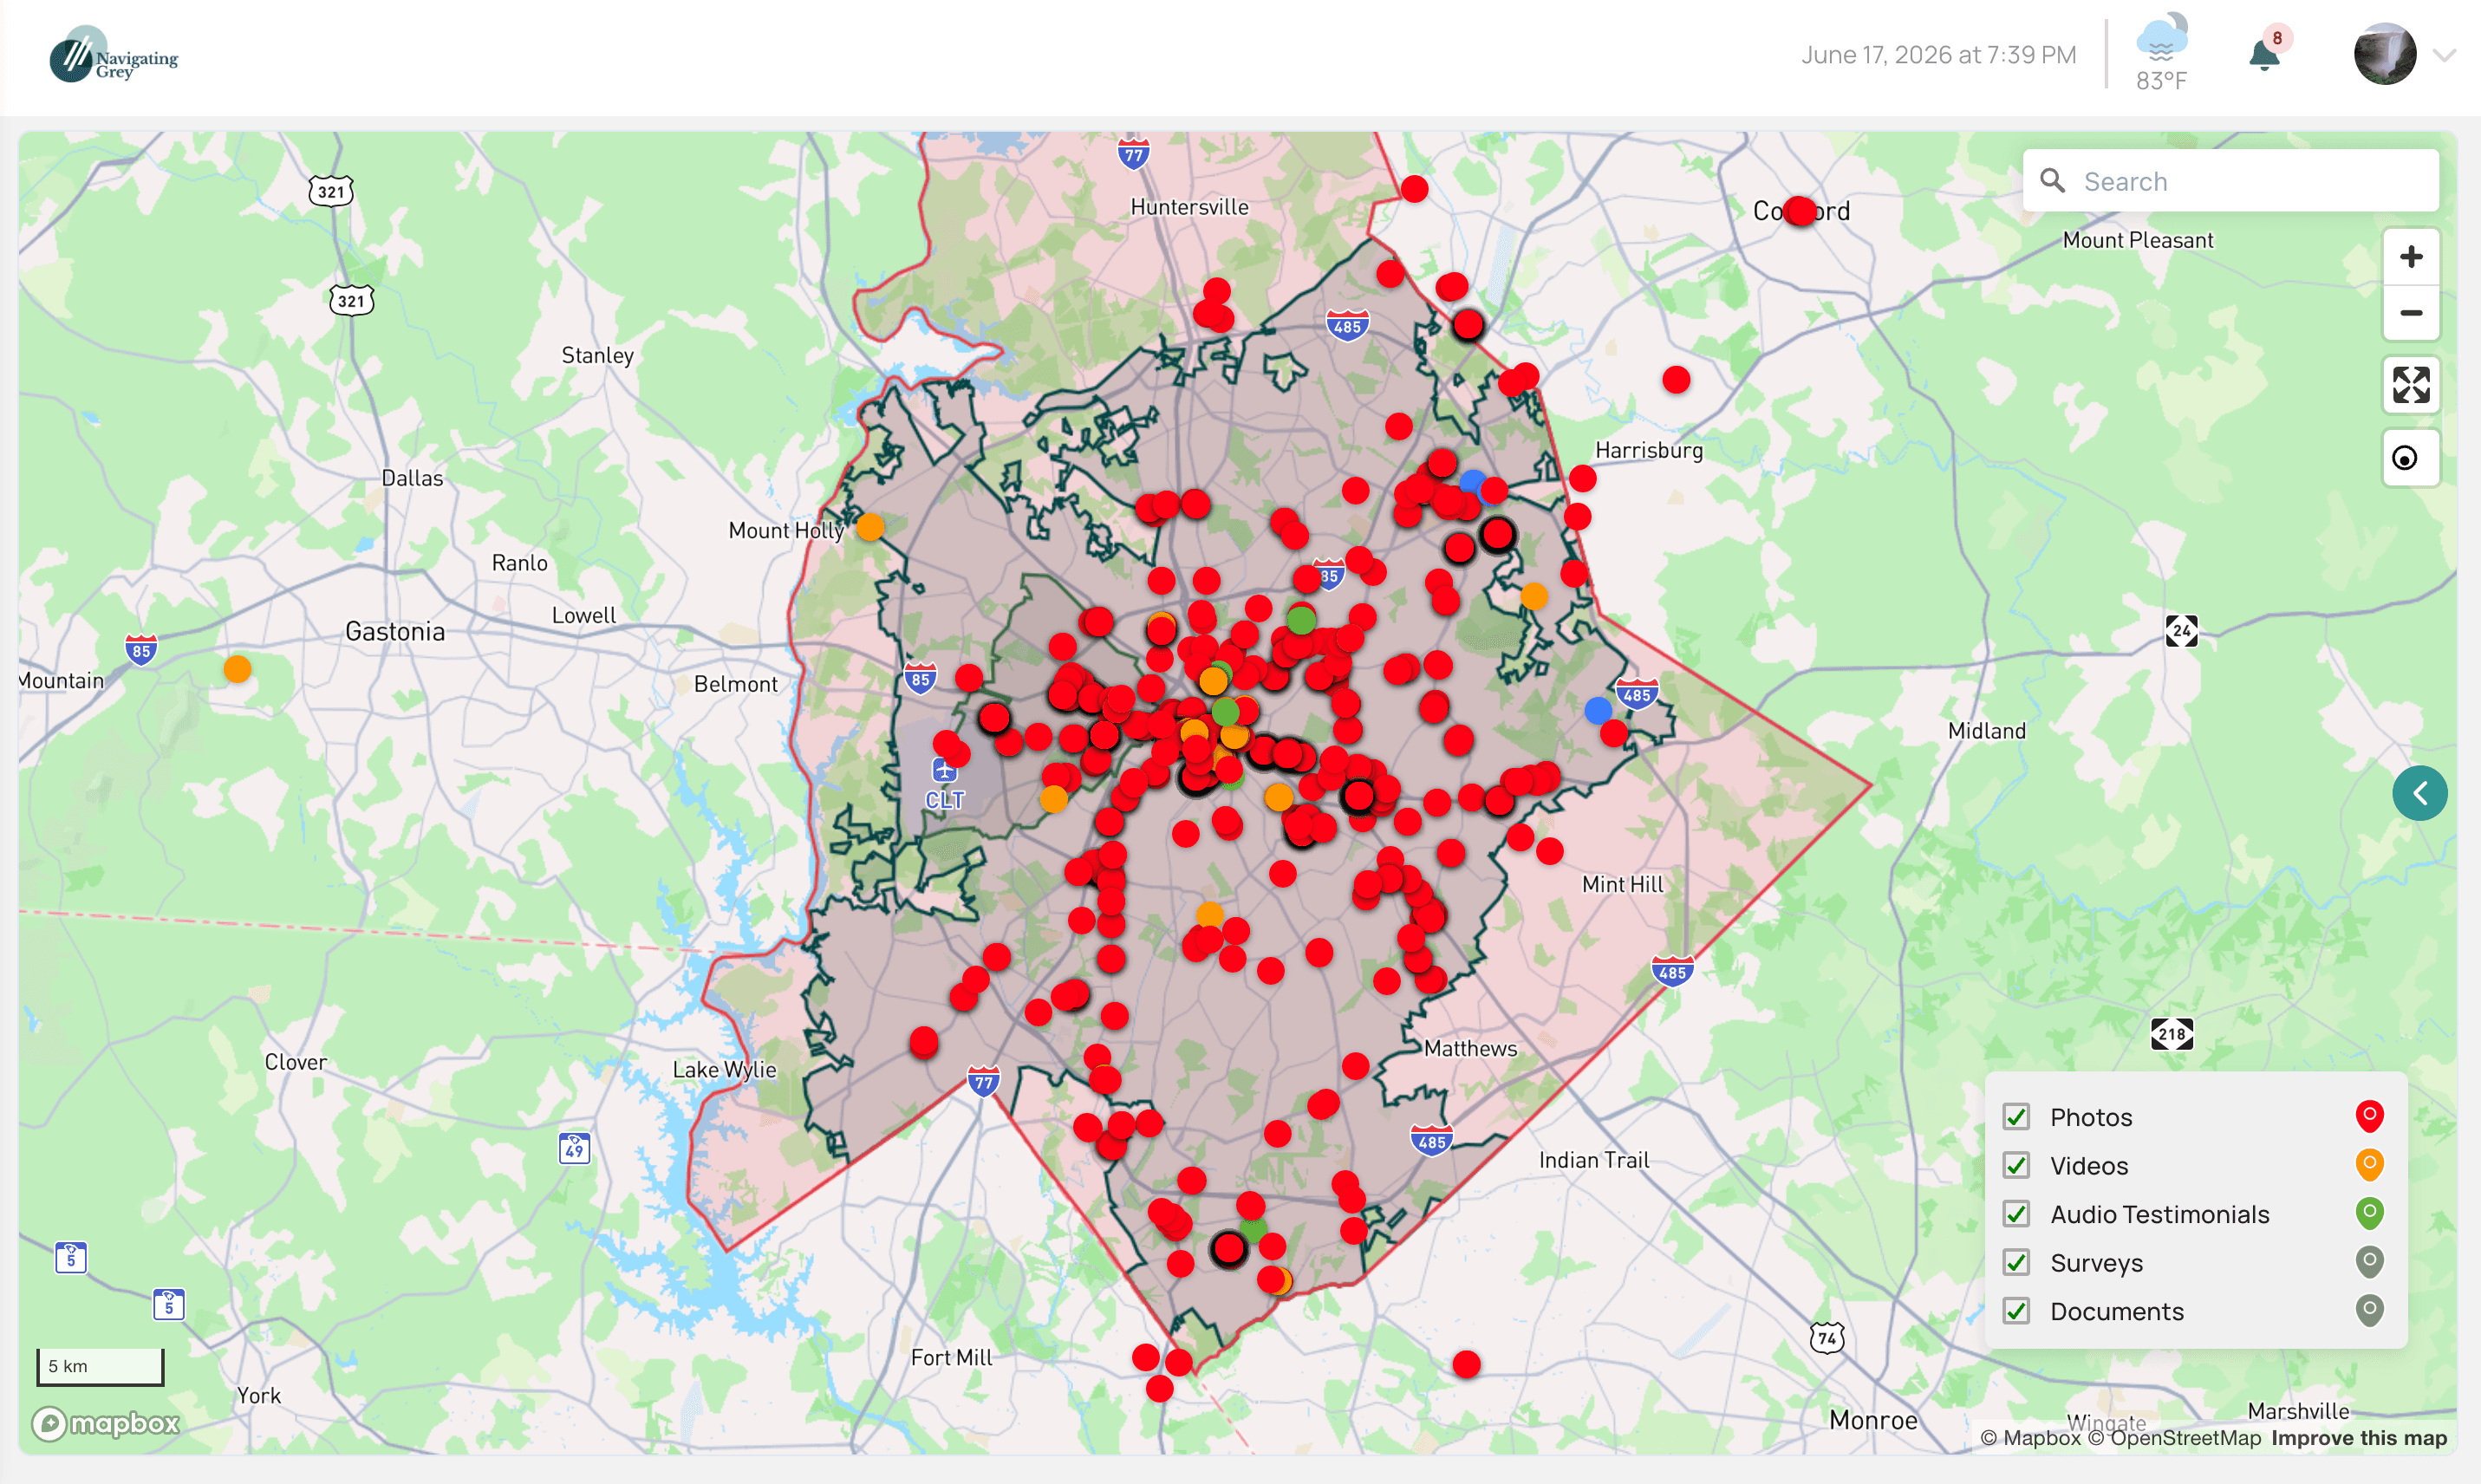
The iMPACT Technology platform from Navigating Grey
The problem
“Trust us, it worked” doesn't cut it anymore.
Most teams still measure impact with a spreadsheet, a one-off survey, and a consultant's deck. What comes out is a single number, averaged across neighborhoods that have nothing in common.
You can't back it up
A number with nothing behind it falls apart the second someone asks, “how do you know?”
It's not local
A national average tells you almost nothing about the block where the work actually happened.
It's already stale
A one-time snapshot can't tell you whether the change stuck around or quietly disappeared.
You're putting real money into real work. You should be able to show what it did.
Four dimensions
Impact isn't flat. So we don't measure it that way.
Impact happens somewhere, over time, to real people, in more ways than one. Navigator keeps all four in view at once.
Geographic
Impact lands differently on every block. We measure it by ZIP code, with census and health data layered in.
Temporal
Change takes time. Capture evidence again and again, and watch the line actually move.
Stakeholder
Impact is something people live. Collect it from them directly, in their own words.
Multifaceted
Most work is economic, social, and environmental all at once. We hold all of it together.
How it works
From the field to the boardroom.
One workflow that takes evidence from the ground and turns it into something you can defend in a meeting.
Capture
Your community and field teams send in geotagged photos, video, audio, and surveys from an app with your name on it.
Aggregate
Everything rolls up by ZIP code, city, and state, with census and health data filled in for you.
Analyze
Score initiatives on ROI, fit, engagement, and risk. Put two communities side by side and compare.
Narrate
Draft the write-up straight from your own data, with AI that only does what you ask it to.
Report
Export a board-ready PDF or a share-ready impact video in minutes, not weeks.
The command center
One place for everyone who needs the proof
Your team works from a single dashboard: the numbers that matter, a real map of where impact is landing, and a feed of evidence as it comes in. No spreadsheets, no waiting on an agency.
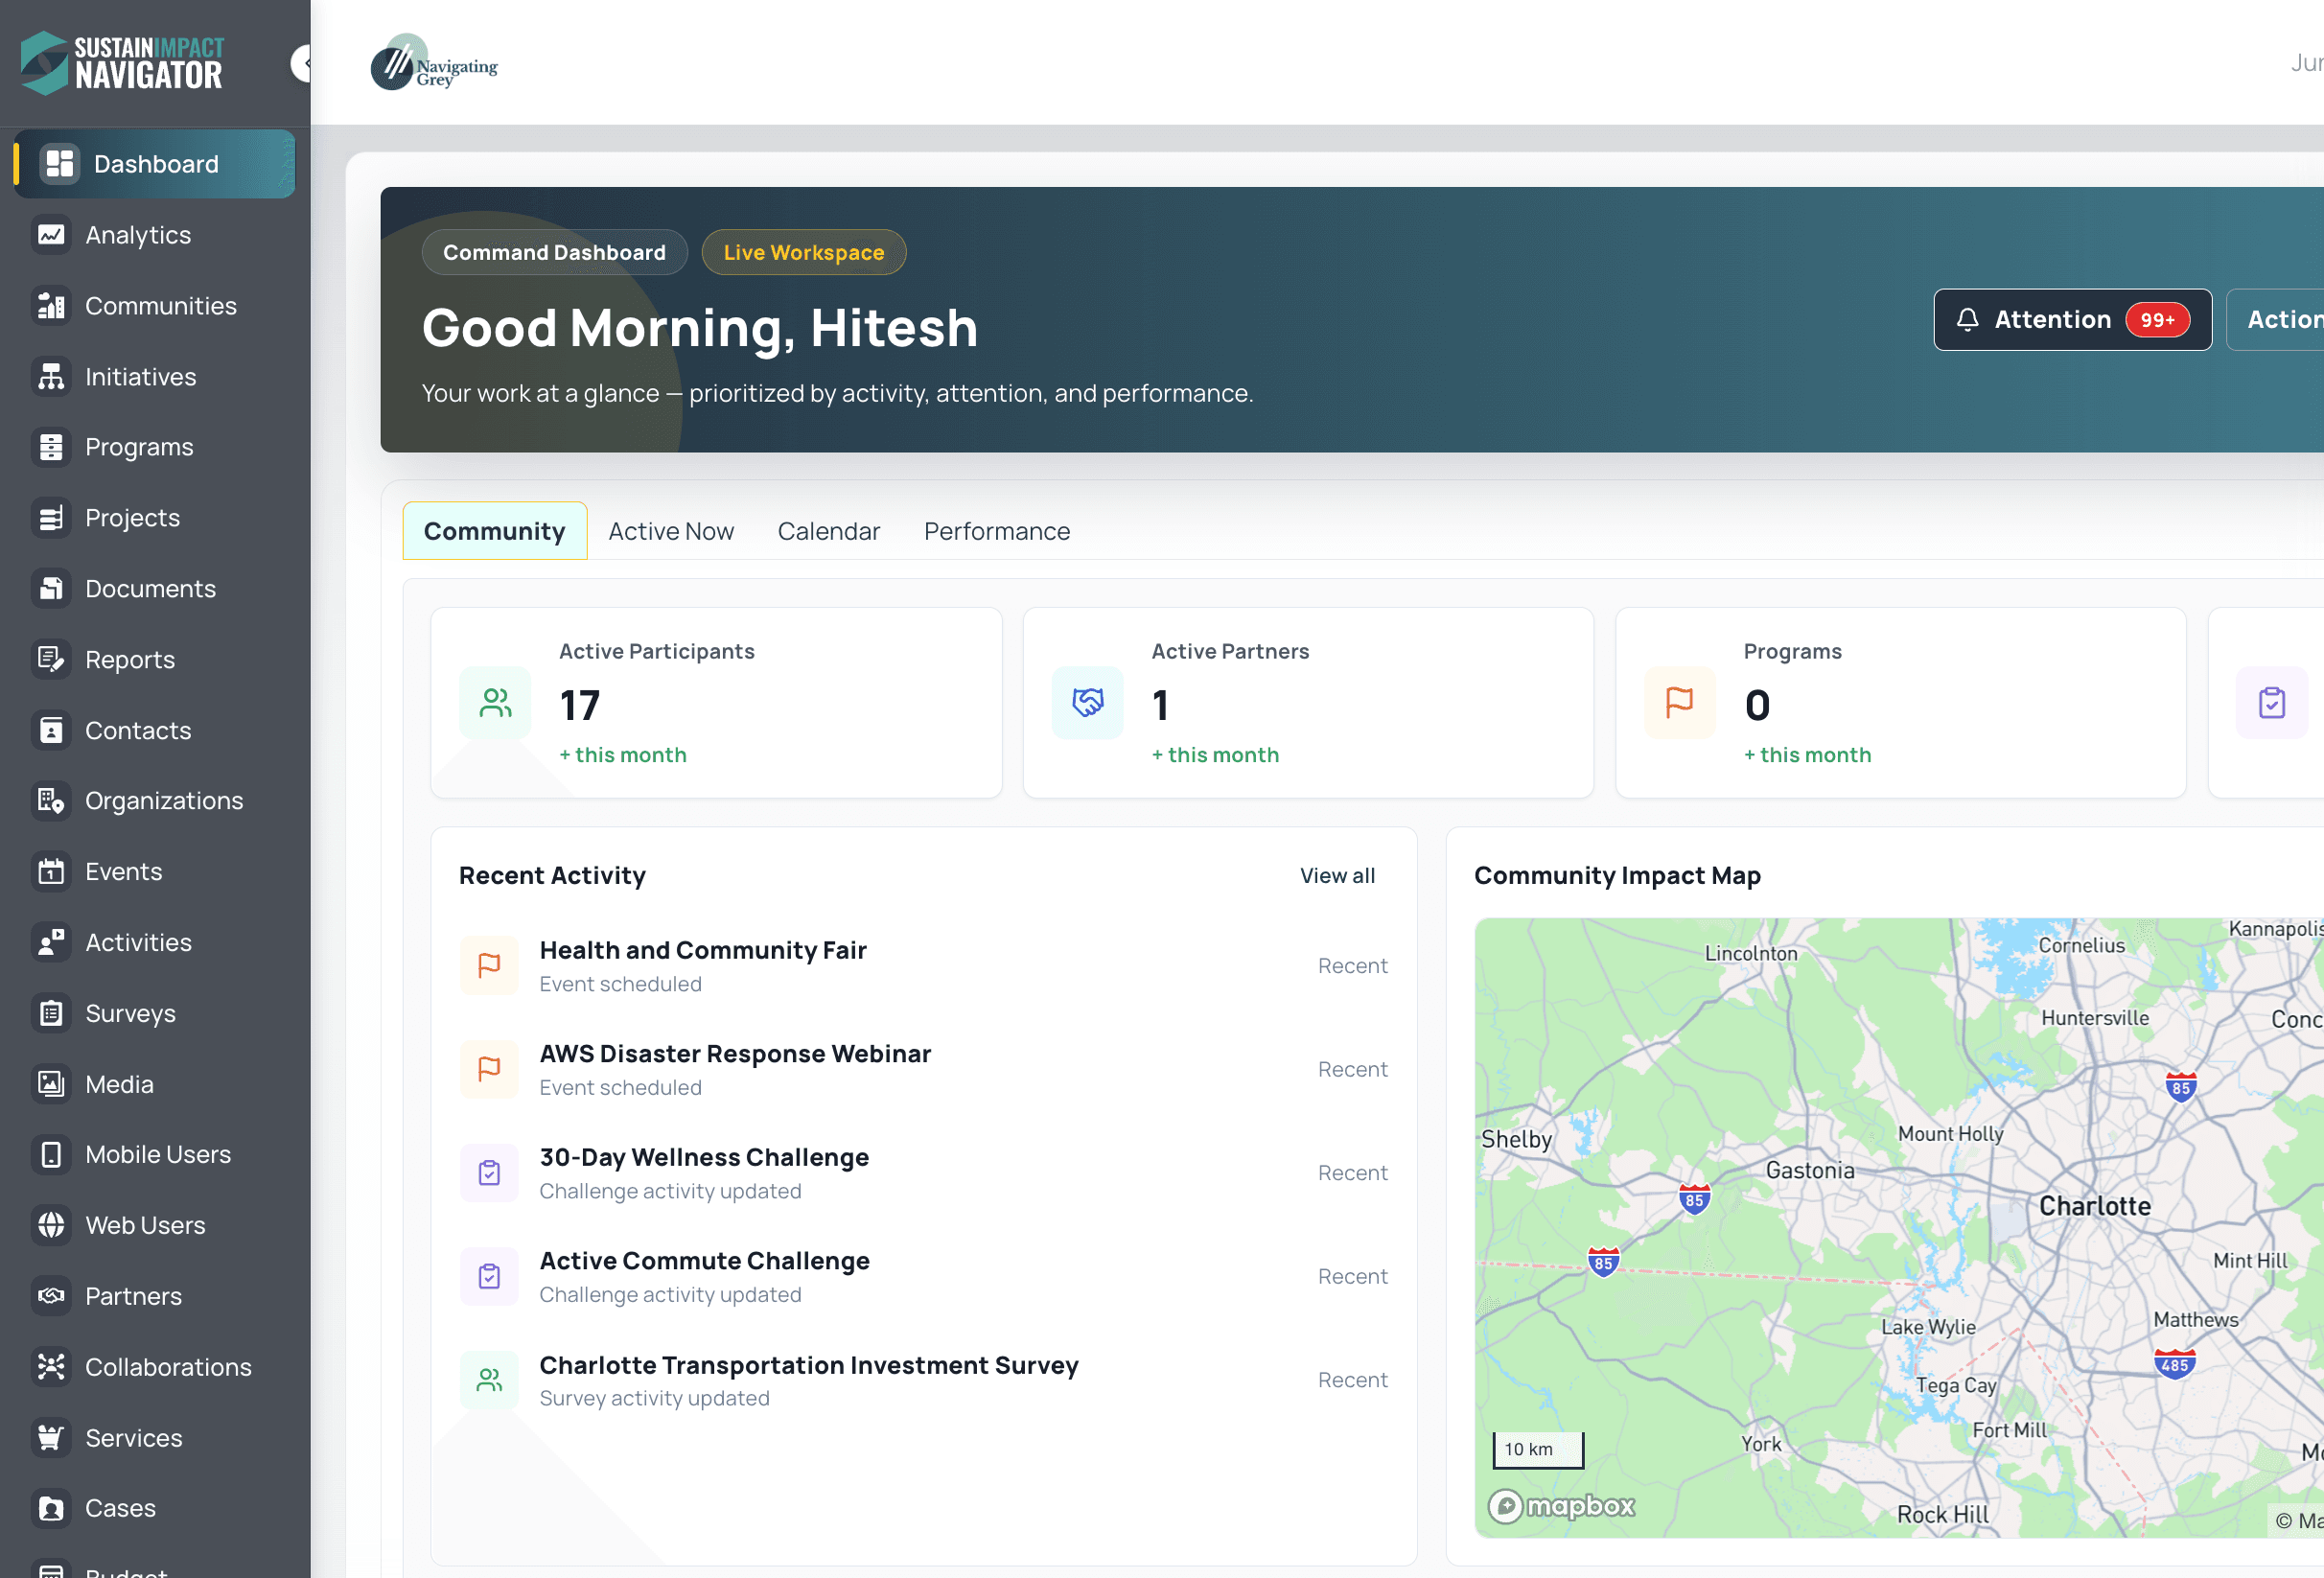
- Numbers that keep themselves current
- Participants, partners, and programs, updated as the work happens.
- A real community map
- Actual ZIP-code lines, opportunity zones, and every piece of evidence pinned in place.
- A live activity feed
- Every survey, event, and challenge, the moment it lands.
The platform
Everything it takes to prove impact.
Governed AI & privacy
AI you can trust with community data.
AI can draft your narratives, transcribe audio, and write captions — but only when you say so. You're collecting evidence from real people, and the whole system is built to keep it safe.
See how we protect your data- Leave any record out of AI
- Blur faces and mask voices
- Two-factor login and role-based access
- Encryption for sensitive records
- Each organization's data kept separate
- Consent tracked every time you collect
Who it's for
Built for the people who have to prove impact.
Proof
What changes once you can actually prove it.
Weeks of reporting turn into an afternoon
AI drafts and a report builder take a pile of field evidence and hand you a finished document. No agency, no all-nighters.
Guesswork turns into ZIP-level truth
Census and health data sit on top of real community lines, so you can see exactly where the work landed.
Claims turn into evidence
Every data point is tied to a time, a place, and a real person who was actually there.
We're early, so case studies are still being written. Want to hear from someone using it? Ask us for references
FAQ
Questions, answered.
See it on your own work.
Book a 30-minute walkthrough. We'll show you how teams capture evidence, measure it by place, and turn it into something they can stand behind.
30 minutes · no pressure, no obligation